 LiDAR (Light Detection and Ranging)
LiDAR (Light Detection and Ranging) has overtaken traditional photogrammetry as the technology of choice for the generation of elevation datasets on large projects or in areas where photogrammetry struggles, such as in leaf-on conditions or in areas of rugged terrain. In addition, the LiDAR sensor that RAM operates can generate more accurate datasets (better than 0.1' vertical accuracy), with faster timelines from collection to delivery.
Nearly all of our projects start with the acquisition of LIDAR, often including simultaneous acquisition of imagery. We have the ability to acquire from either a fixed-wing or helicopter platform, and routinely collect data from both. Our system is designed to accommodate movement between platforms without requiring new calibrations as opposed to many of the systems in the market. Once acquired, the point cloud data is adjusted to surveyed control to ensure that the project can meet the accuracies required.
While no technology can truly 'see through the trees', LiDAR provides a much better chance of hitting the ground in heavily vegetated areas than other technologies. The likelihood of penetrating the canopy is increased with proper flight planning, to include increased point densities and opposing flight lines in some cases. With the techniques employed by RAM, we have been able to accurately generate 1' contour datasets in heavily vegetated areas, even in summer months.
Our management personnel have extended experience with the planning and completion of projects, including the acquisition, processing, hydro flattening, and final deliverables of wide area projects. For projects requiring more accuracy or definition than a typical wide area project, we have the leeway of flying a much denser point spacing from a lower altitude with a helicopter.
We have partnered with several mapping qualified aircraft vendors throughout the United States. Having reliable vendors allows us to mount our sensors on various types of helicopters and fixed-wing aircraft. This enables us to respond quickly to our clients' needs while keeping mobilization costs as low as possible.
 Data Extraction
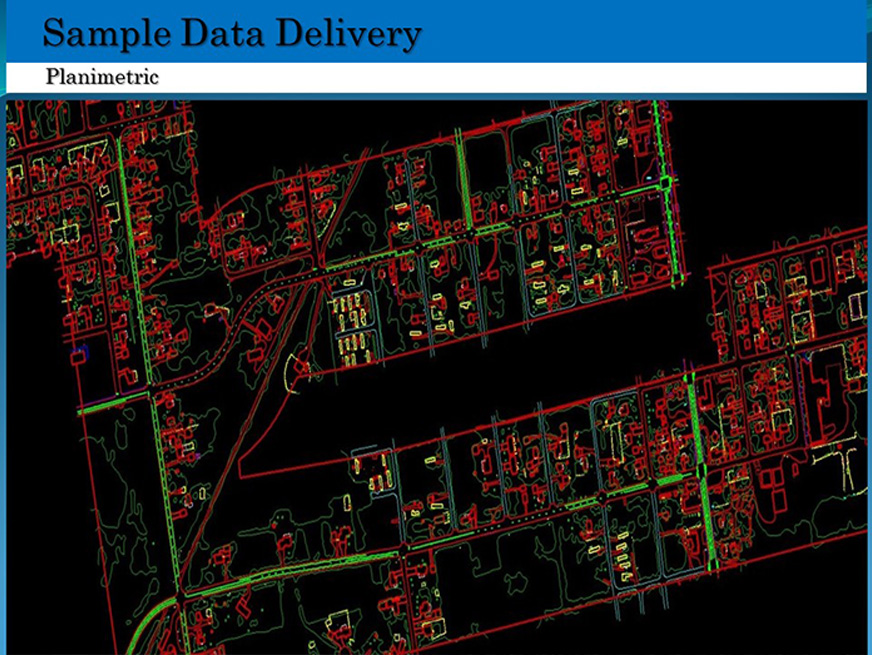
Until just a few short years ago, aerial mapping was completed by relying almost exclusively on imagery for data extraction. Now, the LiDAR densities that we collect can support heads-up feature extraction of most linear features (edge of pavement, structures, fences,...) and many point features (manholes, individual trees, poles,...), and we rely more and more on the LiDAR point clouds in our data extraction processes.
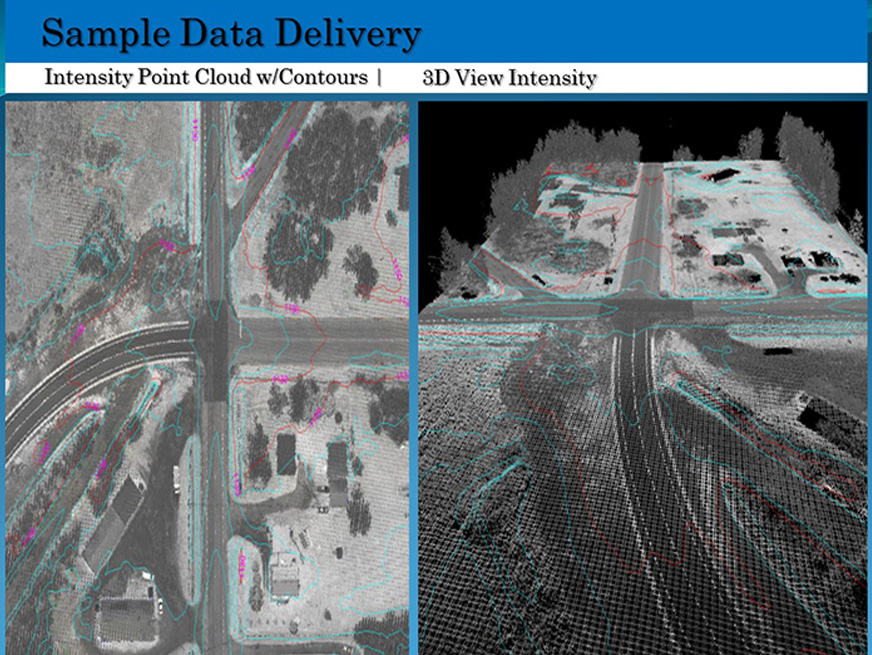
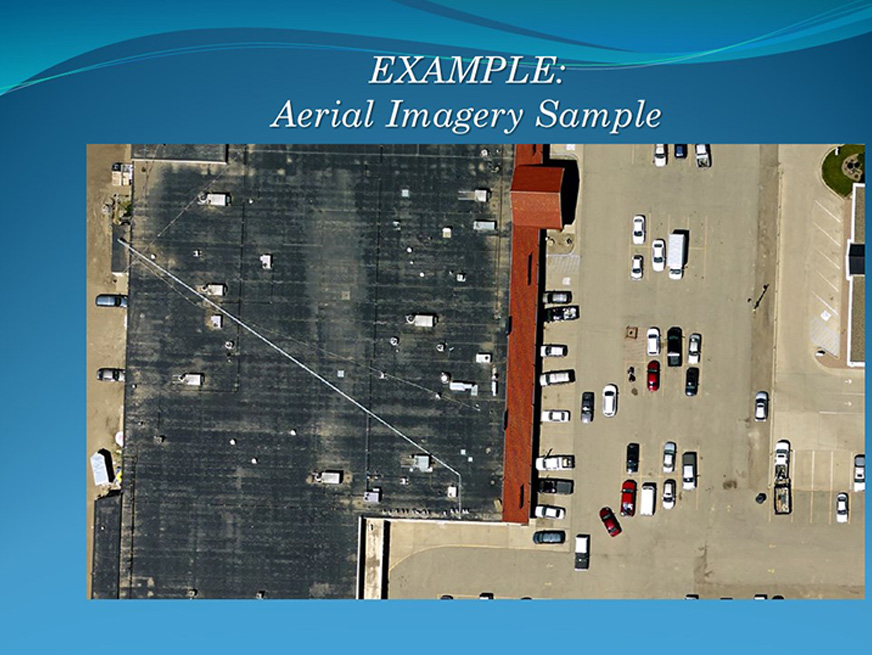
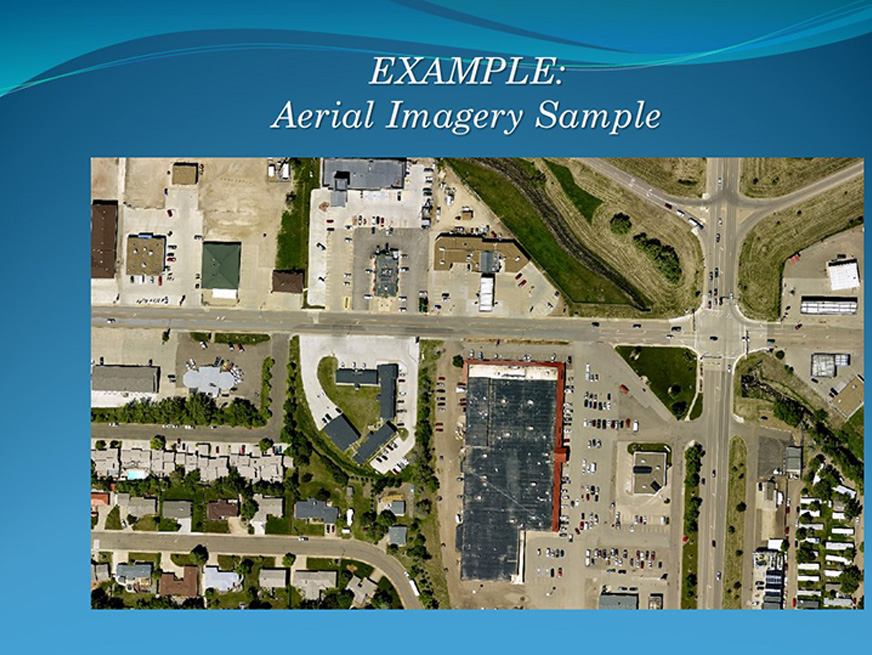
A normal data extraction project for RAM begins with a LiDAR intensity image and an orthophoto generated from imagery flown during the same flight. Since the two datasets are flown at the same time, the positional data (Airborne GPS and IMU) match exactly for each. The result is two very different types of datasets that match each other very closely, and each complements the other in the data extraction process. Horizontal positions of all features are compared to both the LiDAR intensity and orthophotography, and all vertical positions are extracted directly from the LiDAR point class.
The list of features to be extracted is determined through communication with the client, and is incorporated into the scope of work for the project. Through this communication, we can ensure that the features delivered meet the end needs of the project, without unnecessarily increasing the cost or schedule for final delivery.
Once all data has been extracted, we format the data for delivery according to the client's wishes. We routinely deliver in AutoCad or MicroStation formats, or in ESRI shapefile/geodatabase formats. Once extracted, the conversion process from one software to another is straight-forward, and we also often deliver in multiple formats for use by different disciplines on the same project.
 Uses of LiDAR and Aerial Imagery
With both Aerial Imagery and LiDAR, an almost endless amount of GIS Layers can be derived. Here are just some examples of how some people are using LiDAR and Aerial Imagery within their GIS.
Topographic Mapping / Contours
Flood Modeling
Surface Water Modeling / Watershed Monitoring
Building Footprint Extraction / Building Height Extraction
Wetland Mitigation
Soil Surveys
Tree / Canopy vectorization (Forestry)
Geological Studies
Agriculture
Urban and Rural Planning
Storm water Modeling
Image Classification / Land Use Raster
Impervious Surface Mapping
Noise Studies
Environmental Studies
Vegetation Management
Transmission Corridor Monitoring
Volumetric Measurements (Mining)
Wind Farm Modeling
Solar Photovoltaic Deployment Optimization
Planimetric Mapping
Road Digitization
Utility Digitization
Slope Analysis
Transportation
Heads Up Feature Collection
Route Optimizations
 Transportation
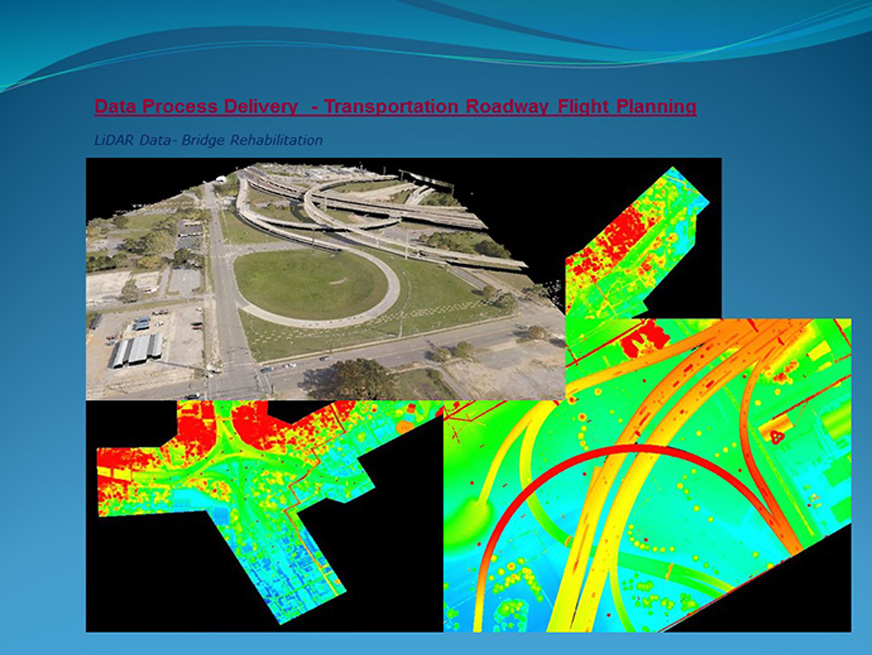
RAM provides support for the transportation sector from initial planning phases to the final design phases. Utilizing the simultaneous acquisition capabilities of our system, LiDAR and imagery is collected for corridors such as roadways or railroads in a single flight.
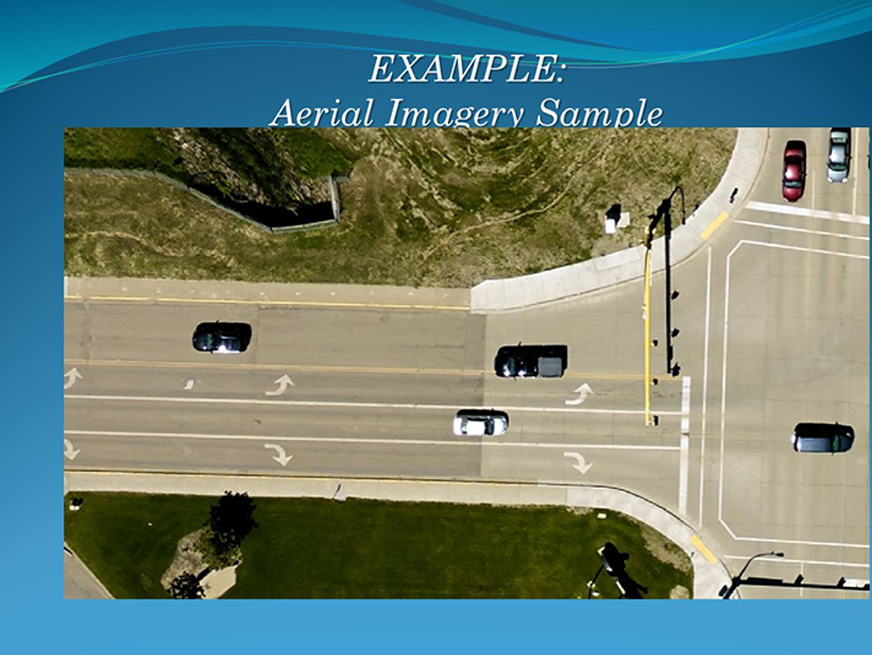
Our support of planning phases such as route selection includes the mapping of terrain at 1' or 2' contour interval, imagery with either a 3" or 6" pixel size, and feature collection of planimetric features such as existing pavement edges, structures, and vegetation.
For the final design phase, we provide a high accuracy dataset that complements traditional "boots on the ground" and significantly reduces the time required for in-the-field acquisition. Given a high accuracy control dataset, we routinely provide final terrain accuracies in the range of 0.05' to 0.1' on paved surfaces. The feature list is significantly more robust than a planning phase project, and includes the mapping of such features as manholes, fire hydrants, and catch basins. Our typical deliverables for transportation projects include CADD files in either AutoCad or MicroStation formatted to either client or state Department of Transportation CADD standards, as well as InRoads or GeoPak dtm deliverables.
We have successfully completed projects for private engineering firms and a number of DOTs. Our projects have included rail corridors, interstates, City Wide Mapping, and state and county routes.
Elevation Data (up 0.1' vertical accuracy)
Planimetrics (Roads, Structures, etc)
CADD Deliverables
InRoads/GeoPak Deliverables
Imagery
Top-of-Rail sections
 Sample dot deliveries
95% of Data Provided will Meet the Following:
The relative cross sectional slope accuracy is 0.25% though the data representing the interstate surface
The TxDOT accuracy standard places limits on the root mean square error (RMSE) for individual position components: northing, easting, and elevation. The limiting horizontal RMSE for large scale (1:20,000 or larger) Class 1 maps is 0.01" at the specified map scale.
Design level mapping has a limiting RMSE for the X and Y coordinates individually of 0.4 feet. The limiting vertical RMSE for large scale maps is 1/3 of the indicated contour interval for general elevation points and 1/6 of the indicated contour interval for spot elevations on well-defined features. A one foot contour interval is the typical for TxDOT design level mapping unless otherwise specified.
A map compiled for a one foot contour interval has a limiting RMSE of 0.33 feet for general terrain and 0.17 feet for well-defined terrain features
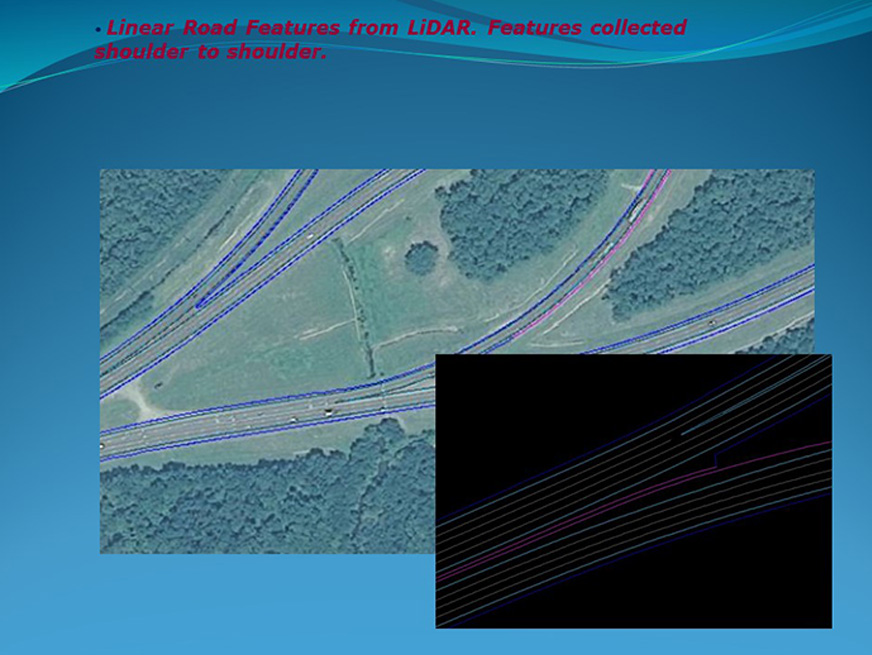
Linear Road Features from LiDAR. Features collected shoulder to shoulder.
Lane Lines
Outside Lane Edges
Interstate Low Shoulder Lip Grade
Interstate EOP Grade
Wall Foot Grade
LiDAR Accuracy Generation of Tin, as described.
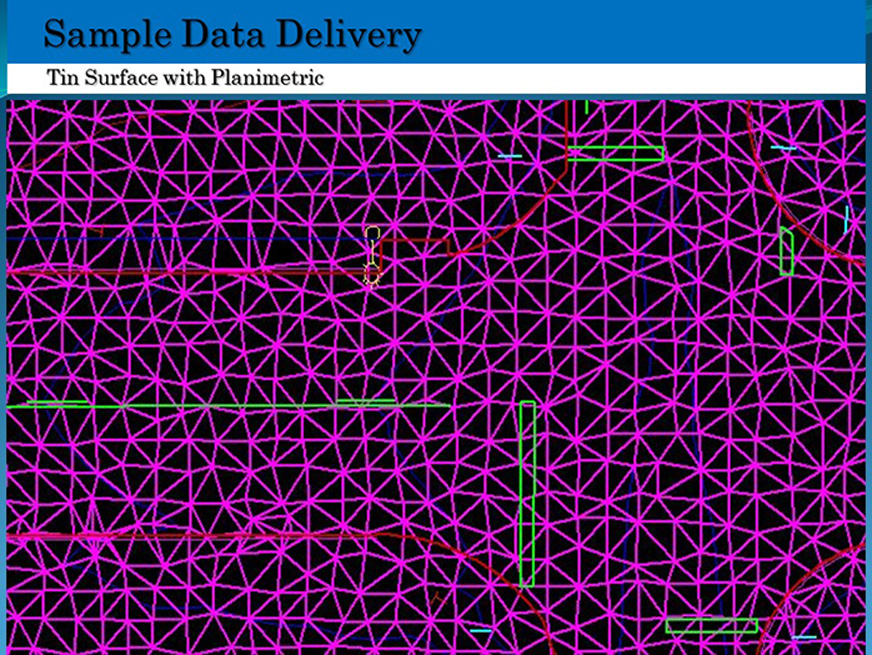
From EOP to EOP, Tin generated with setting of 10’ max length and 0.1’ above/below tolerances
Outside EOP, Tin will be generated with settings of 25’ max length and 0.33’above/below tolerances
Generation of 1’ contours generated from the Tin’s and collected breaklines
Field Check of LIDAR DATA
Testing for map accuracy compliance may be performed for any map produced for TxDOT. TxDOT may contract testing to a vendor (typically independent from the aerial mapping vendor) or may conduct testing using state resources.
For any testing effort, a written summary of the results of the testing is required. A table summarizing the results of the field check shall be provided to TxDOT and will include:
The point number and a description of each check point.
The XYZ coordinates for each point derived from the photogrammetric map data.
The XYZ coordinates for each check point determined by field surveying.
The difference between each of the coordinates and the RMSE value determined from the differences
The independent source of higher accuracy for checkpoints shall be at least three times more accurate than the required accuracy of the geospatial data set being tested. Horizontal checkpoints shall be established shall be established at well-defined points. A well-defined point represents a feature for which the horizontal position can be measured to a high degree of accuracy and position with respect to the geodetic datum.
For the purpose of accuracy testing, well-defined points must be easily visible or identifiable on the ground, on the independent source of higher accuracy, and on the product itself.
For testing orthoimage, well-defined points shall not be selected on features elevated with respect to the elevation model used to rectify the imagery.
Unlike horizontal checkpoints, vertical checkpoints are not necessarily required to be clearly defined or readily identifiable point features. Vertical checkpoints shall be established at locations that minimize interpolation errors when comparing elevations interpolated from the data set to the elevations of the checkpoints. Vertical checkpoints shall be surveyed on flat or uniformly-sloped open terrain and with slopes of 10% or less and should avoid vertical artifacts or abrupt changes in elevation
 Transportation Roadway Projects Accuracy
LiDAR
1200’ Swath High Density Aerial LiDAR
Simultaneous Image Acquisition
Complete 3D Model of Corridor
Rapid Data Acquisition Times
SAFETY (no personnel within R/W)
ACCURATE DESIGN AND MAPPING
Cross Slope Accuracy within 0.25 %
Cross Sections at any Station
Crown Delineation and Lane Profiles
0.25’ Orthophotography
LiDAR Accuracy Report verified by field
Precise Milling Quantities
DOT Planimetrics

 Ortho photography

 Electric Transmission Lines
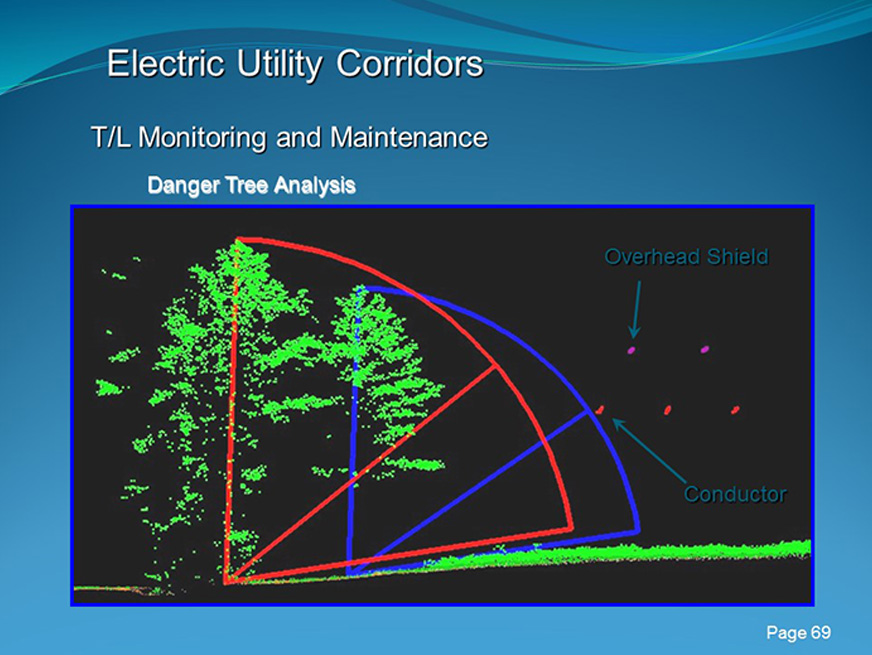
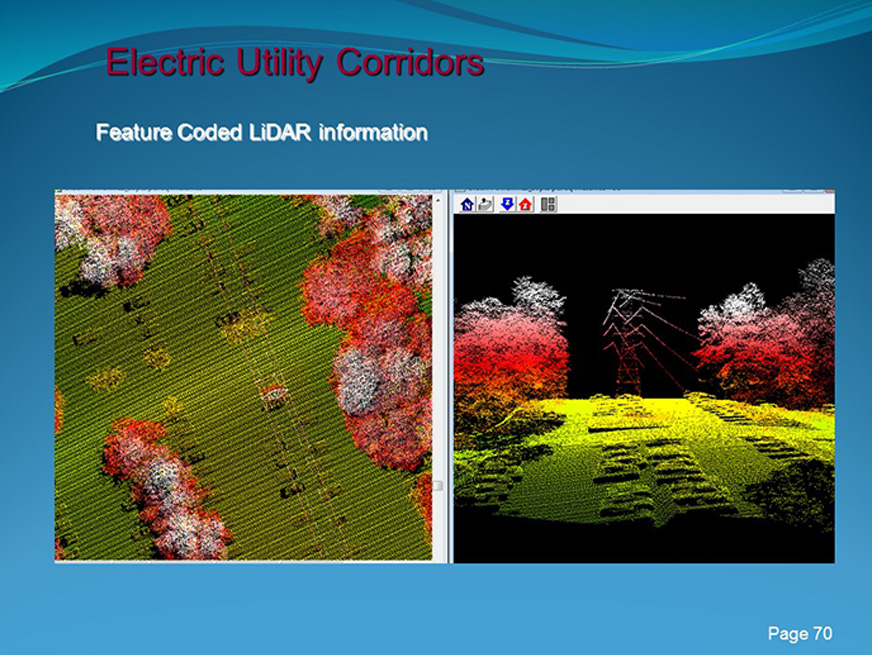
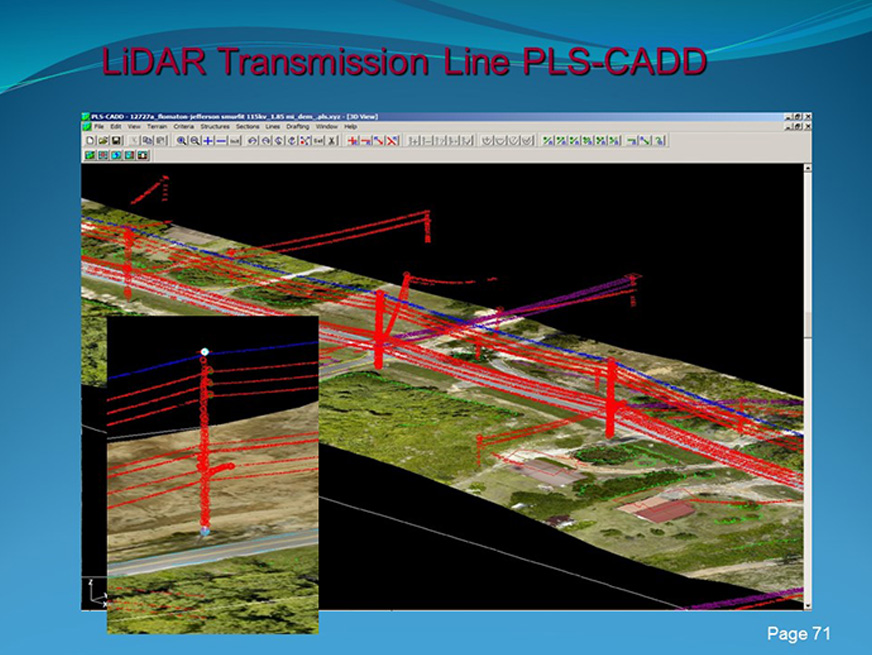
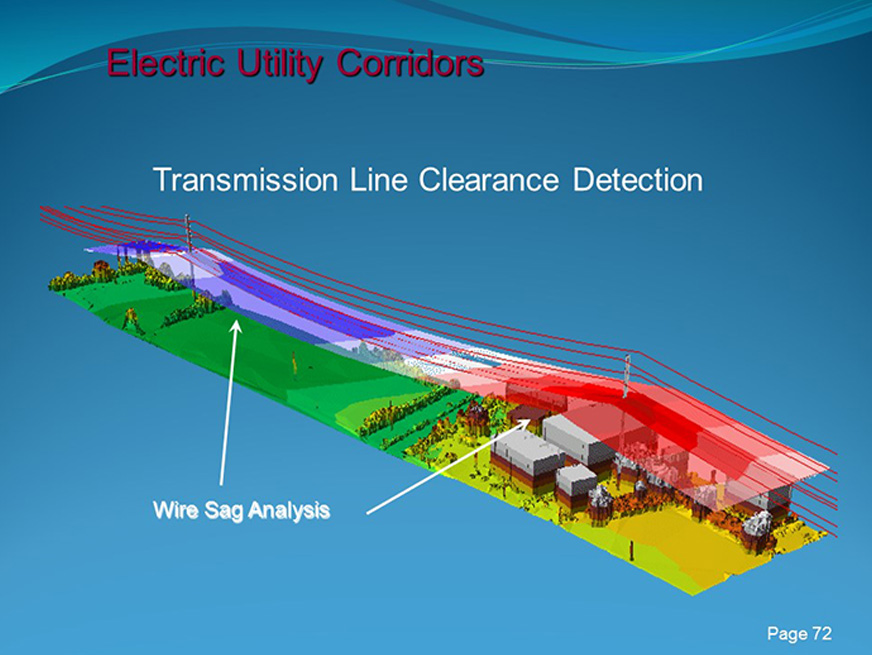
We are well familiar with the unique requirements of electric transmission projects, including the delivery of datasets in PLS-CADD format and the collection of data utilizing weather stations during acquisition. Our equipment is also ideal for Energy corridor projects, with the ability to acquire LiDAR, nadir imagery, and oblique imagery and video in the same flight. Not only does this reduce the costs associated with long corridor projects, but this also provides multiple views of the same project taken at the same point in time.
 Electric Transmission Lines
 Oil/Gas Pipelines
 Imagery
 Oblique Imagery/Video
 CADD or PLS-CADD deliverables
 Weather Data


281-750-6709

21417 Lambeth Ridge Lane Kingwood, Texas 77339


